I Backtested a Simple Bitcoin Strategy Over 11 Years. It Beat Buy & Hold by 2x.
Going long BTC when the daily close crosses above the 20-day EMA, with a 50-day SMA trend filter, turned $10,000 into $4.2 million over 11 years. Buy & hold? $2 million. And you're only in the market half the time.
This includes 0.1% trading fees on every single trade.
The Problem with "Just HODL"
Every crypto bro will tell you to just buy and hold Bitcoin. And honestly, it's not terrible advice. BTC went from $350 to $69,000 between 2014 and 2026. That's a 20,000% return.
But here's what they don't tell you: you had to sit through an 83% drawdown in 2018. Your $100K portfolio dropped to $17K. Then again in 2022, a 76% drawdown. Most people don't survive that psychologically. They panic sell at the bottom and buy back at the top.
What if there was a simple system that captures most of the upside while getting you out before the worst crashes?
The System: EMA20 + SMA50 Filter
Two rules. That's it.
Entry: Buy BTC when the daily candle closes above the 20-day EMA, but only if price is also above the 50-day SMA.
Exit: Sell when the daily candle closes below the 20-day EMA.
No leverage. No shorting. No fancy indicators. When you're not in a trade, you sit in cash.
The SMA50 acts as a trend filter. It keeps you out of bear markets. If BTC is below its 50-day average, no new entries. Period.
The Equity Chart
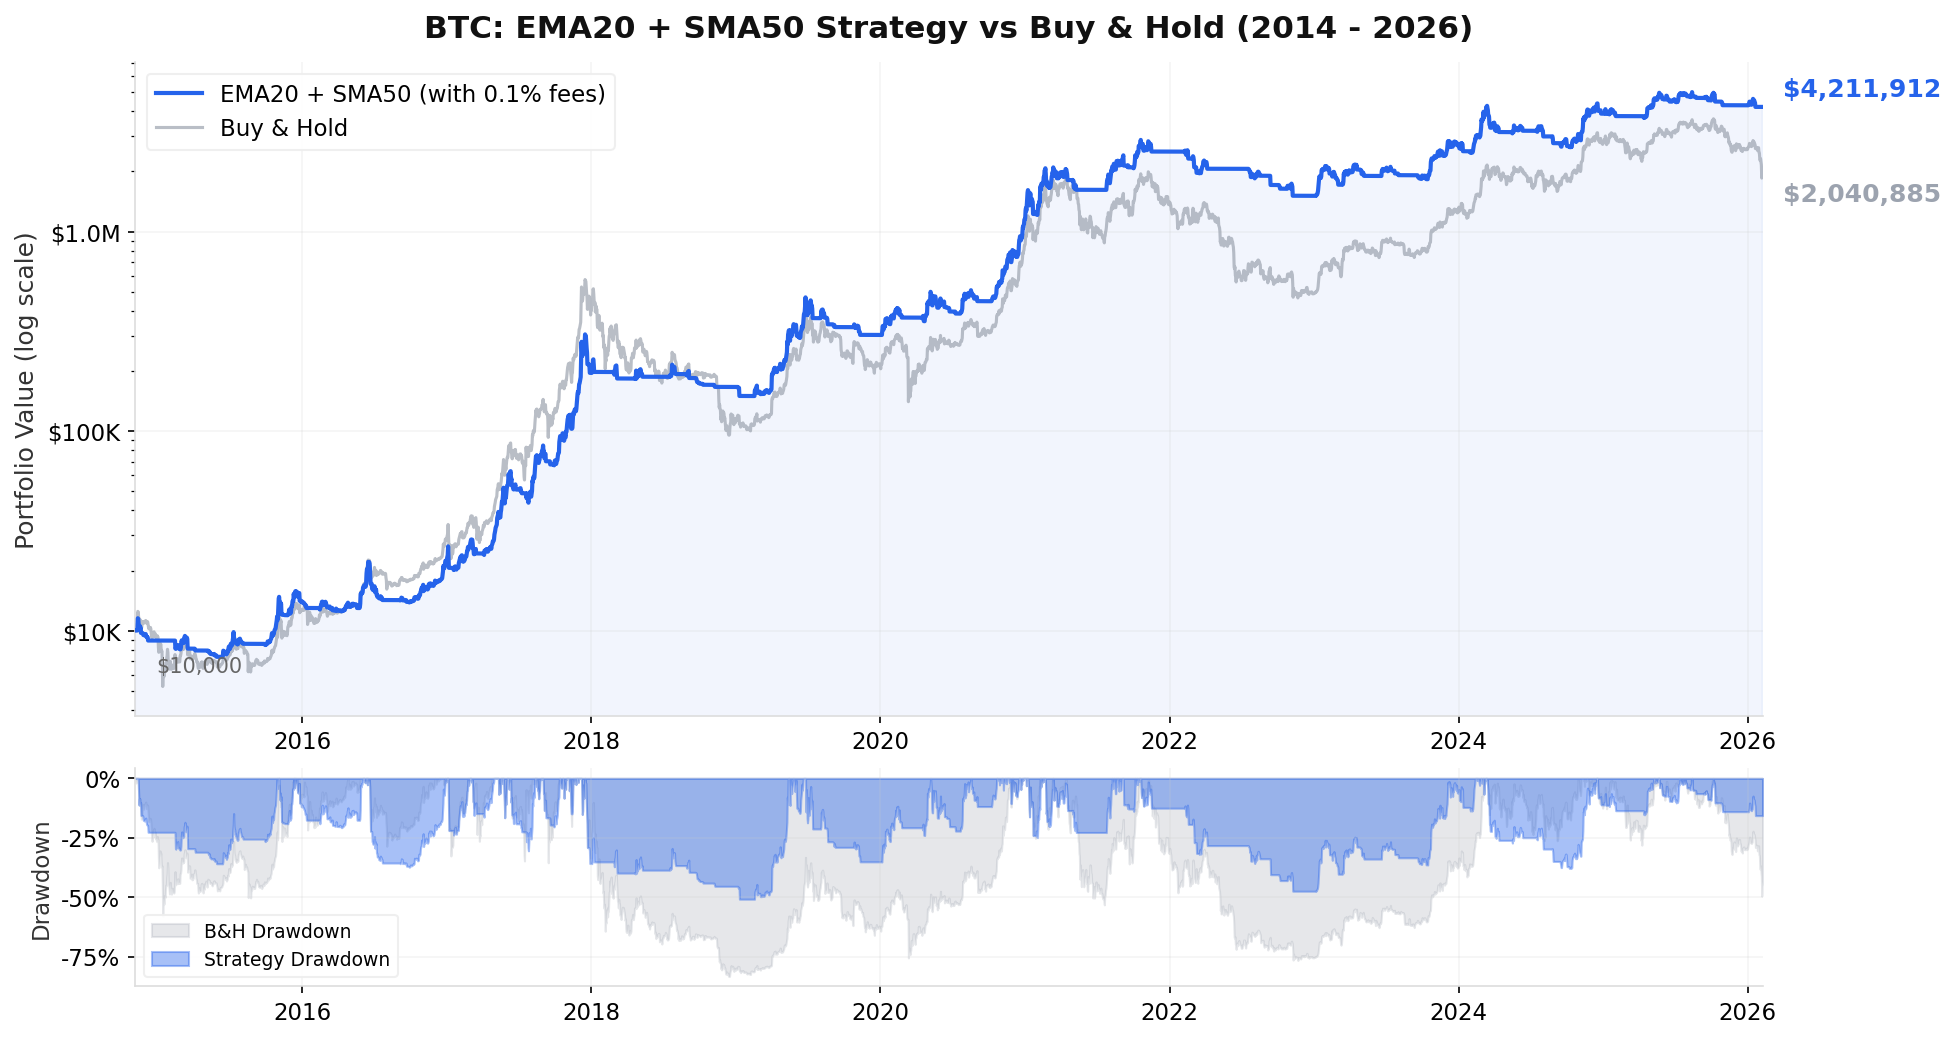
The blue line is the strategy (with 0.1% fees per trade). The grey line is buy & hold. This is a log scale chart, so equal vertical distances represent equal percentage moves.
Two things jump out:
- The strategy pulls ahead during 2017 by riding the bull run and stepping aside during corrections
- 2018 and 2022 are where it really shines. While buy & hold drops 83%, the strategy limits the damage to under 50%
The bottom panel shows drawdowns. The grey (buy & hold) drawdown is consistently deeper than the blue (strategy). That 83% B&H drawdown in 2018 is brutal. The strategy never goes past 51%.
The Numbers
| Metric | EMA20 + SMA50 (with fees) | Buy & Hold |
|---|---|---|
| Total Return | +42,019% | +20,309% |
| CAGR | +71% | +60% |
| Sharpe Ratio | 1.18 | 0.86 |
| Max Drawdown | 50.9% | 83.4% |
| Final Equity | $4,211,912 | $2,040,885 |
| Time in Market | ~48% | 100% |
Starting capital: $10,000. Period: November 2014 to February 2026. All results include 0.1% fee per trade.
The strategy doubled buy & hold returns while being in the market less than half the time. The Sharpe ratio (risk-adjusted returns) is 1.18 vs 0.86, significantly better on a per-unit-of-risk basis.
Trade Statistics
| Stat | Value |
|---|---|
| Total Trades | 155 round trips |
| Trades per Year | ~14 |
| Win Rate | 34.2% |
| Average Winner | +22.7% |
| Average Loser | -3.2% |
| Profit Factor | 3.68 |
Yes, the win rate is only 34%. You lose on most trades. But when you win, you win 7x more than when you lose. That's the essence of trend following. Cut losers fast, ride winners long.
A profit factor of 3.68 means for every $1 lost, the system makes $3.68 back.
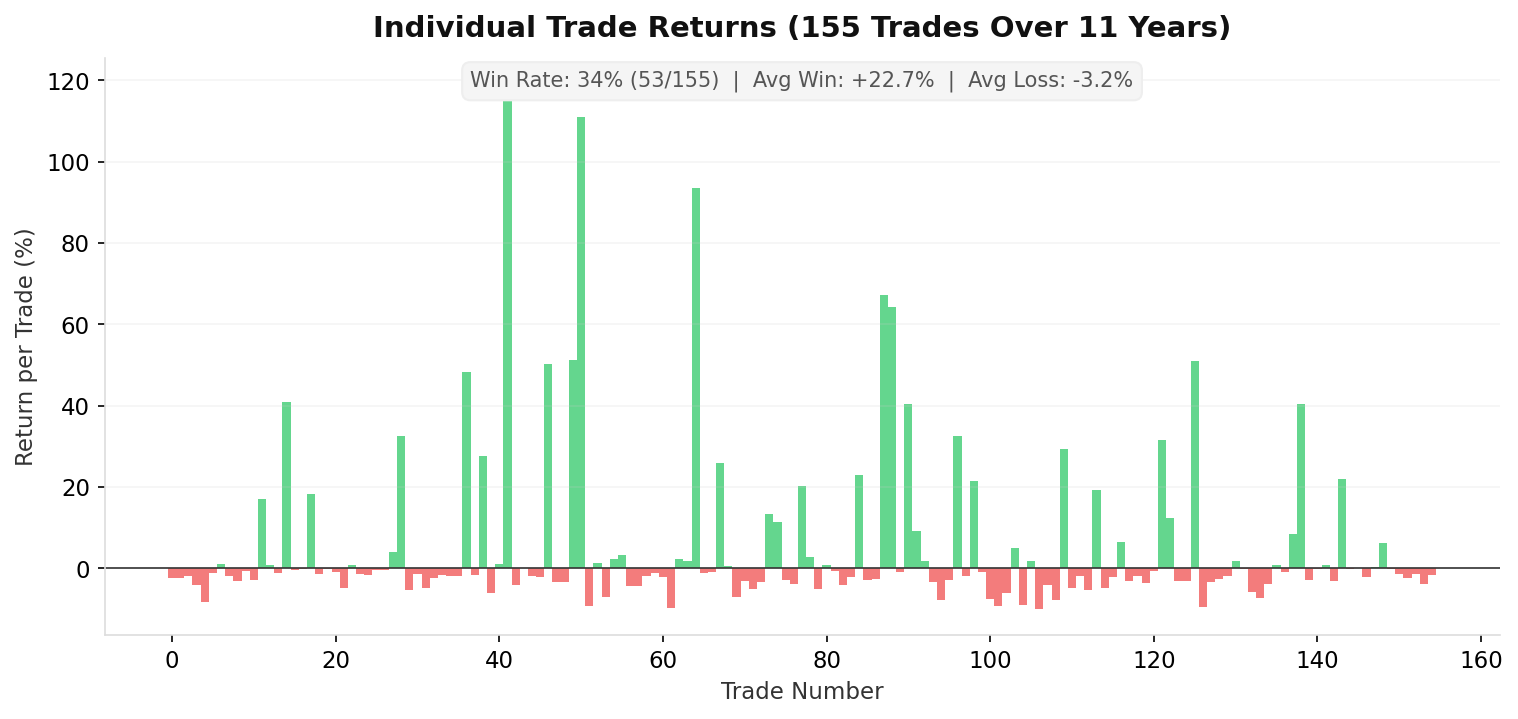
The chart above shows every single trade. The green bars (winners) are fewer but much taller. The red bars (losers) are frequent but tiny. A few massive winners in 2017 and 2020-2021 drive the bulk of the returns. This is normal for trend-following systems. You need to let the winners run.
Year-by-Year Breakdown
| Year | EMA20 + SMA50 | Buy & Hold | Winner |
|---|---|---|---|
| 2014 | -10% | -30% | Strategy |
| 2015 | +60% | +37% | Strategy |
| 2016 | +63% | +122% | B&H |
| 2017 | +784% | +1,318% | B&H |
| 2018 | -13% | -73% | Strategy |
| 2019 | +87% | +87% | Tie |
| 2020 | +291% | +302% | B&H |
| 2021 | +121% | +58% | Strategy |
| 2022 | -39% | -65% | Strategy |
| 2023 | +84% | +155% | B&H |
| 2024 | +49% | +112% | B&H |
| 2025 | +13% | -7% | Strategy |
| 2026 | -2% | -22% | Strategy |
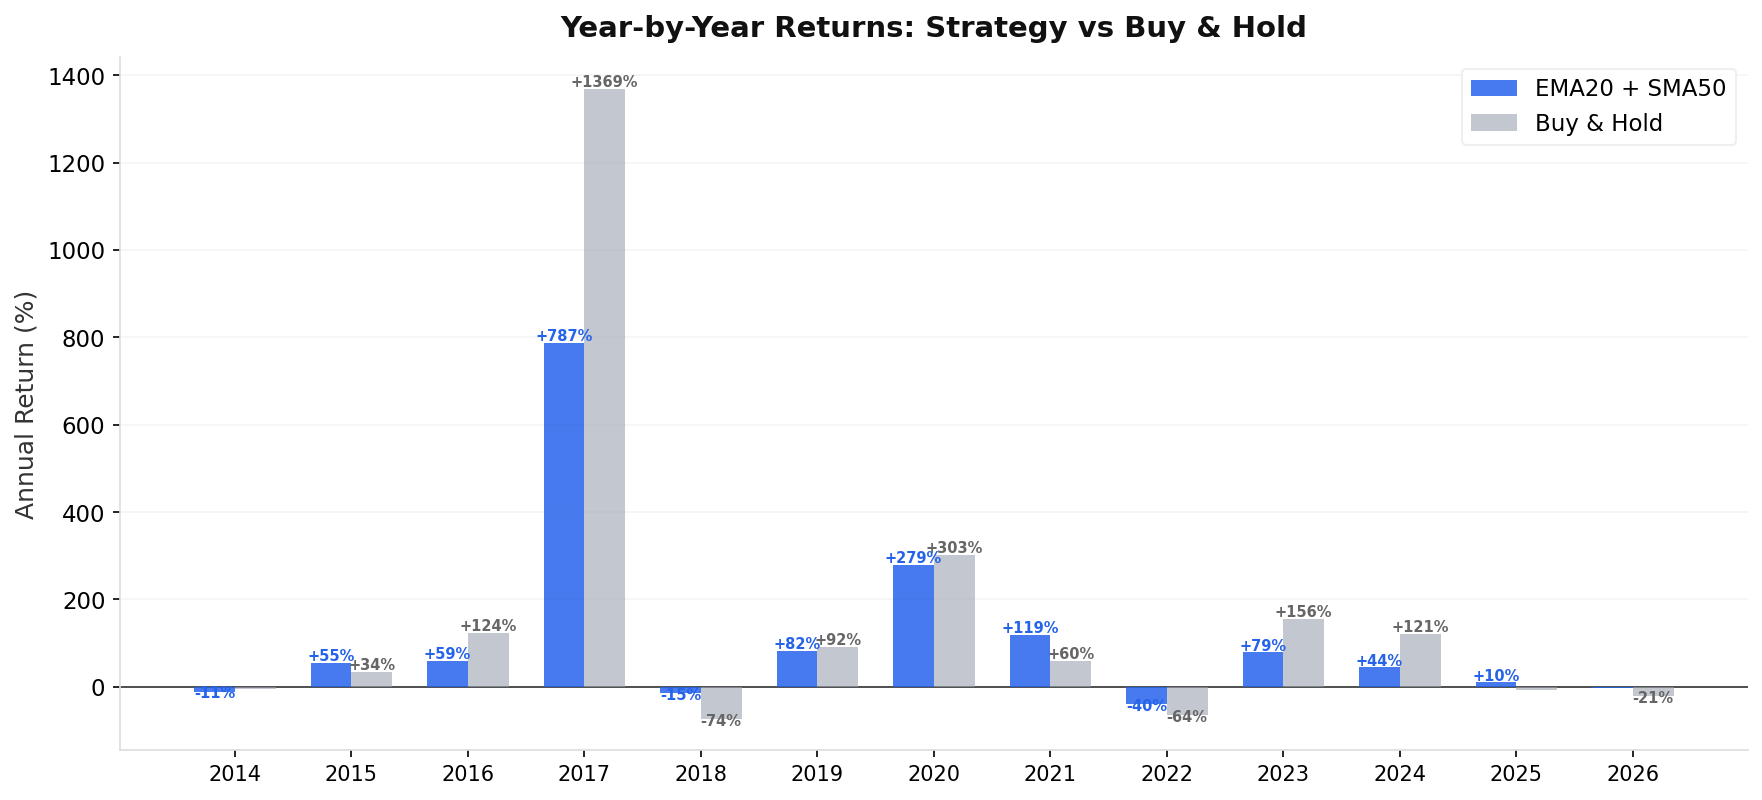
The strategy underperforms in strong, uninterrupted bull years (2016, 2017, 2023, 2024). The EMA20 crossovers cause whipsaws when BTC is ripping straight up. But it outperforms in every single bear and choppy year (2014, 2015, 2018, 2021, 2022, 2025, 2026).
The real edge is capital preservation. Losing 13% instead of 73% in 2018 means you have far more capital to compound in the next bull run. That compounding effect is how the strategy ends up ahead despite "losing" more individual years to buy & hold.
What About Trading Fees?
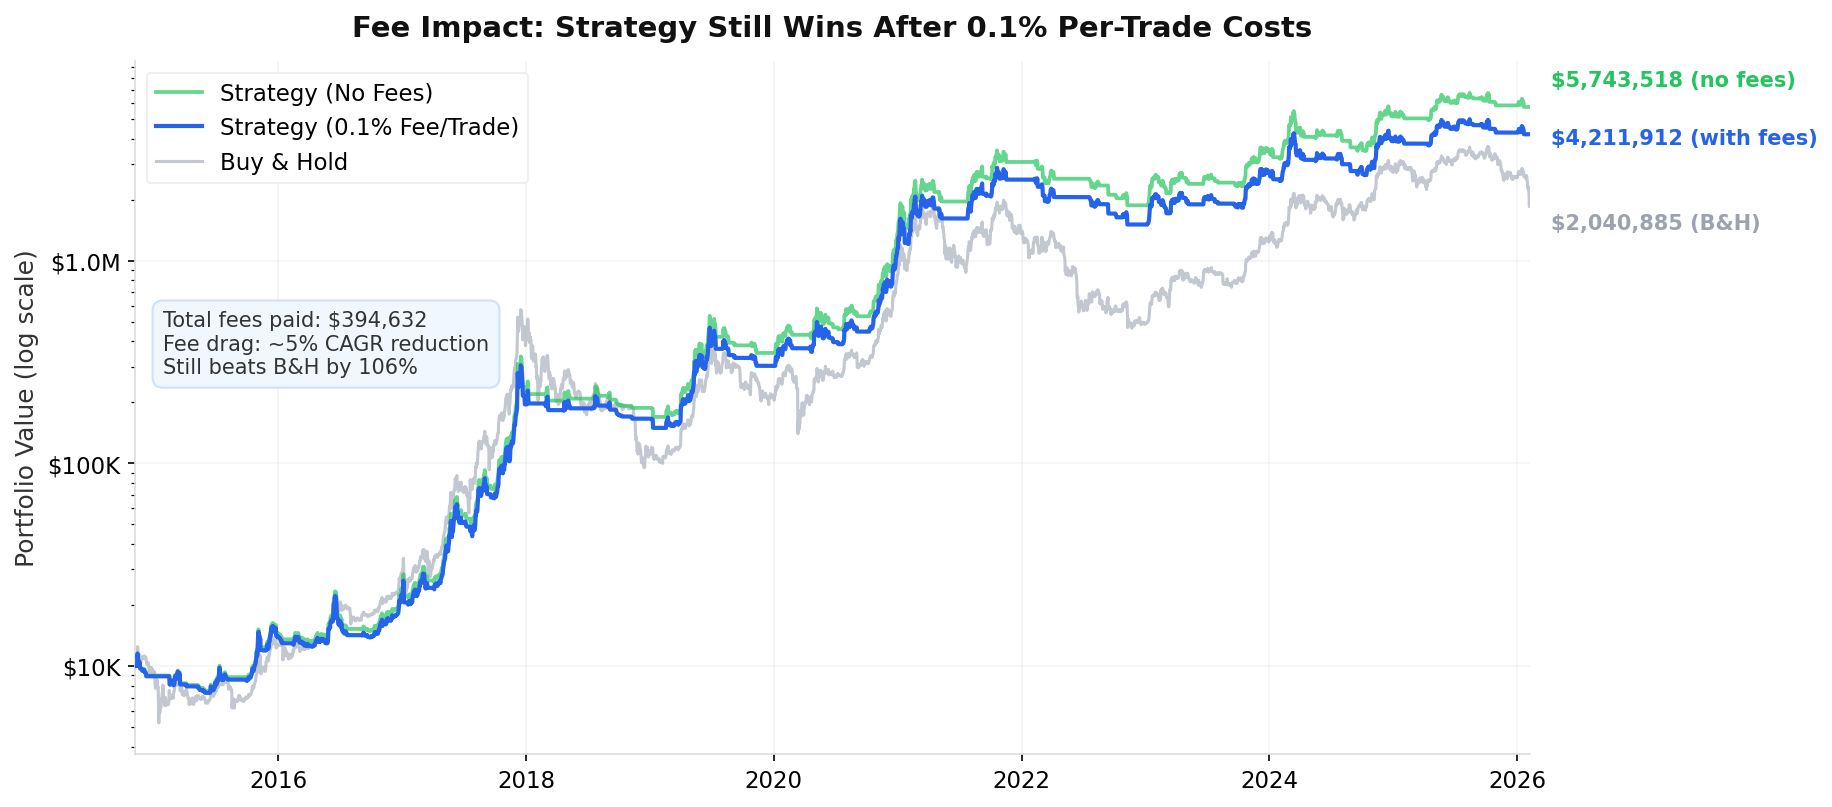
I tested this with realistic 0.1% fees per trade (both entry and exit). Over 11 years and 155 trades, total fees paid came to about $394,000. That sounds like a lot, but it's on a portfolio that grew to millions.
| Metric | No Fees | With 0.1% Fee | Buy & Hold |
|---|---|---|---|
| Final Equity | $5,743,518 | $4,211,912 | $2,040,885 |
| CAGR | +76% | +71% | +60% |
Fees shaved about 5 percentage points off the annual return (76% to 71%). That's meaningful but not strategy-breaking. The strategy with fees still beats buy & hold by 106%. Even if you doubled the fee assumption to 0.2% per trade, the strategy would still come out ahead.
What I Tested (and What Didn't Work)
I didn't just test the SMA50 filter. I backtested 10 different variations to find the best one:
| Variant | Return | Sharpe | Max DD |
|---|---|---|---|
| Original EMA20 (no filter) | +1,601% | 1.15 | 57% |
| + SMA50 Filter | +3,091% | 1.40 | 46% |
| + Weekly EMA Filter | +1,557% | 1.20 | 39% |
| + Trailing Stop 10% | +1,159% | 1.00 | 64% |
| + Trailing Stop 2x ATR | +1,264% | 1.03 | 62% |
| + 5-day Cooldown | +1,204% | 1.08 | 60% |
| + ADX > 25 Filter | +828% | 0.98 | 61% |
| + 1% Threshold | +2,563% | 1.32 | 53% |
(Note: These variant numbers are from a 7-year subset. The full 11-year results with fees are shown in the main tables above.)
What worked: The SMA50 filter was the clear winner. The 1% threshold (requiring price to close 1% above EMA20, not just touch it) came in second. Both are simple trend confirmation mechanisms.
What didn't work: Trailing stops actively hurt returns in crypto. BTC is too volatile. A 10% trailing stop gets triggered on routine pullbacks during a bull run, kicking you out of winning trades too early. The ADX filter also underperformed. BTC trends don't always register high ADX at the start, so you miss the beginning of moves.
The lesson: In crypto, simple beats complex. The best improvement was adding a single filter, not stacking multiple indicators on top of each other.
The Rules
ENTRY:
  Timeframe: Daily chart
  Condition 1: Daily close > 20-day EMA
  Condition 2: Daily close > 50-day SMA
  Action: Buy BTC with 100% of capital

EXIT:
  Condition: Daily close < 20-day EMA
  Action: Sell entire position

POSITION SIZING:
  100% of equity per trade
  No leverage
  Compound all profits

No shorting, no partial positions, no manual overrides.
You check once a day after the daily candle closes. If both conditions are met and you're not already in, you buy. If the exit condition triggers, you sell. That's it. No staring at charts all day.
Caveats
This is a backtest, not a guarantee. A few things to keep in mind:
Slippage is not modeled. The backtest assumes you can execute exactly at the daily close price. In practice, there's always some slippage, especially during volatile moves. On a liquid asset like BTC, this should be small (a few basis points), but it adds up over 155 trades.
The 2014-2026 period was mostly bullish. BTC went from $350 to $69,000. Any long-only system will look good in a market that 200x'd. The real test is whether this approach protects capital in a prolonged, multi-year bear market worse than 2018.
50% max drawdown is still painful. This is better than buy & hold's 83%, but losing half your portfolio is not comfortable. Size your positions accordingly. This should not be your entire net worth.
Survivorship bias. We're backtesting BTC because it survived and went up massively. The same strategy on a coin that went to zero would obviously not have saved you. The system doesn't protect against fundamental failure of the asset itself.
Tax implications. 14 trades per year means 14 taxable events per year. Depending on your jurisdiction, this could significantly reduce after-tax returns compared to buy & hold (which defers all gains).
Why I Think This Works
The EMA20 + SMA50 system works because it exploits Bitcoin's tendency to trend. BTC doesn't mean-revert like some equities do. When it starts moving in a direction, it tends to keep going. Momentum is real in crypto, and it's been consistent across multiple market cycles now.
The SMA50 filter is the key ingredient. It answers a simple question: "Is Bitcoin in an uptrend right now?" If yes, take the EMA20 signals. If no, sit on your hands. This single addition nearly doubled the returns of the raw EMA20 crossover system.
It won't catch the exact bottom. It won't sell the exact top. But it'll get you in somewhere near the start of a move and out somewhere near the end. And over 11 years, that's enough to more than double buy & hold, even after trading fees.
Sometimes the best trading system is the boring one.
Backtest performed on BTC/USDT daily data from Binance (2014-2019) and Hyperliquid (2019-2026). All calculations use daily close prices with 0.1% fee per trade. Starting capital $10,000. No leverage, no shorting.