A Simple Momentum Strategy That Turned $10K Into $2.4M
What if you only held the 3 hottest stocks in the Nasdaq-100 every month? No machine learning, no complex signals — just buy whatever went up the most over the last 90 days.
I backtested this from 2002 to 2026 using the actual historical Nasdaq-100 roster (not today's stocks cherry-picked backward), and the results are hard to ignore.
The Strategy in 5 Steps
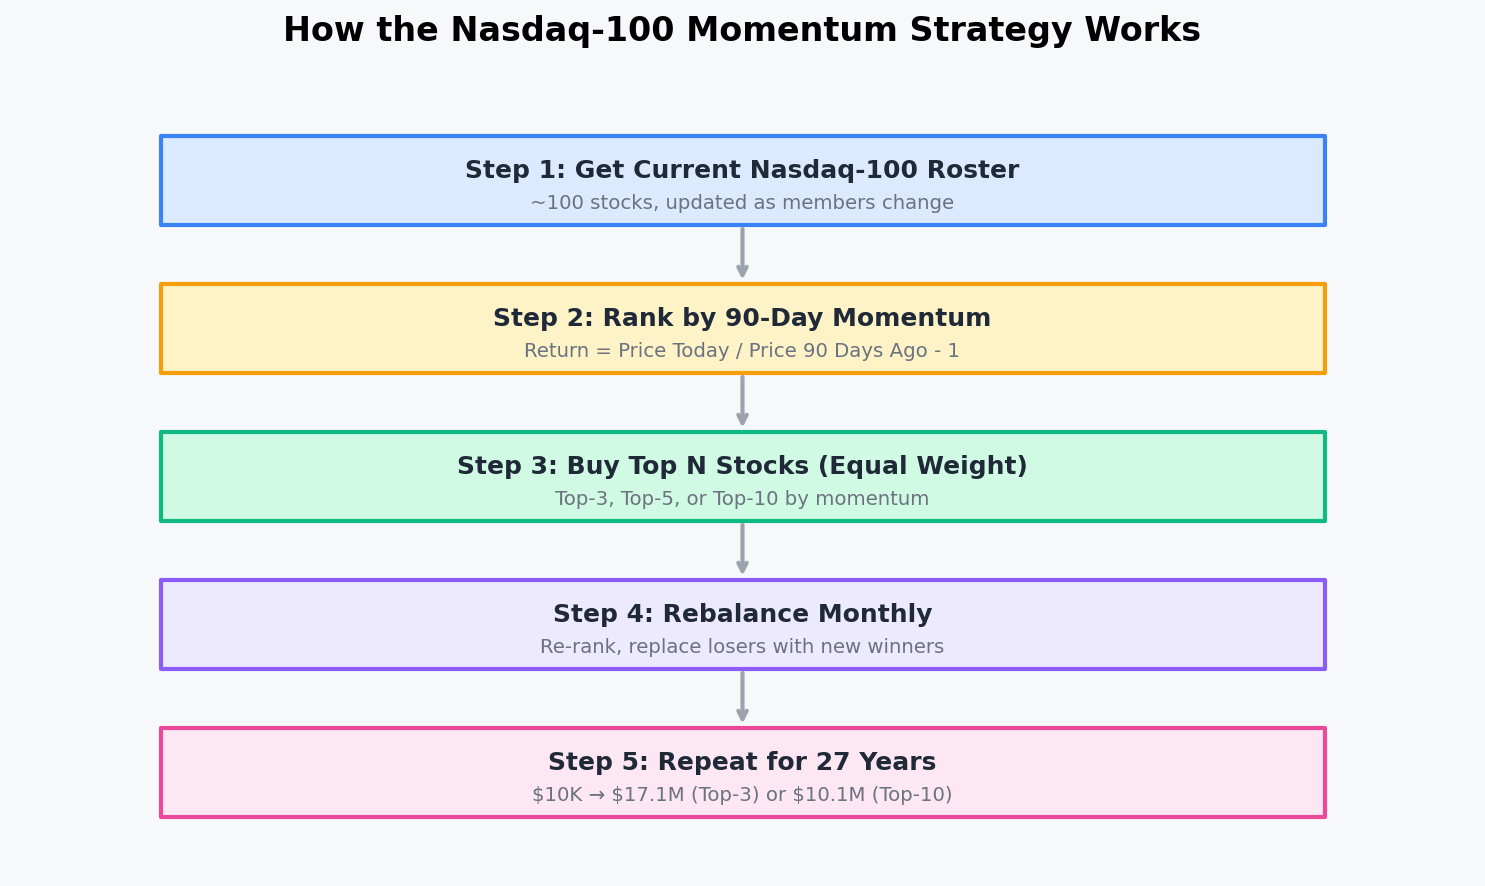
- Universe: The actual Nasdaq-100 members at each rebalance date (not a fixed list)
- Signal: 90-day price momentum (simple trailing return)
- Selection: Buy the top 3, 5, or 10 stocks by momentum
- Weighting: Equal weight across all positions
- Rebalance: Monthly, with 10 basis points transaction costs baked in
That's it. No stop losses, no sector filters, no volatility adjustments. Pure relative momentum.
24 Years of Results
| Strategy | CAGR | Sharpe | Max Drawdown | $10K Becomes |
|---|---|---|---|---|
| Top-3 Momentum | 25.6% | 0.81 | -63.0% | $2.4M |
| Top-10 Momentum | 24.8% | 0.95 | -56.6% | $2.1M |
| Top-5 Momentum | 23.7% | 0.83 | -57.5% | $1.7M |
| QQQ Buy & Hold | 12.7% | 0.64 | -53.4% | $180K |
| SPY Buy & Hold | 9.7% | 0.58 | -55.2% | $93K |
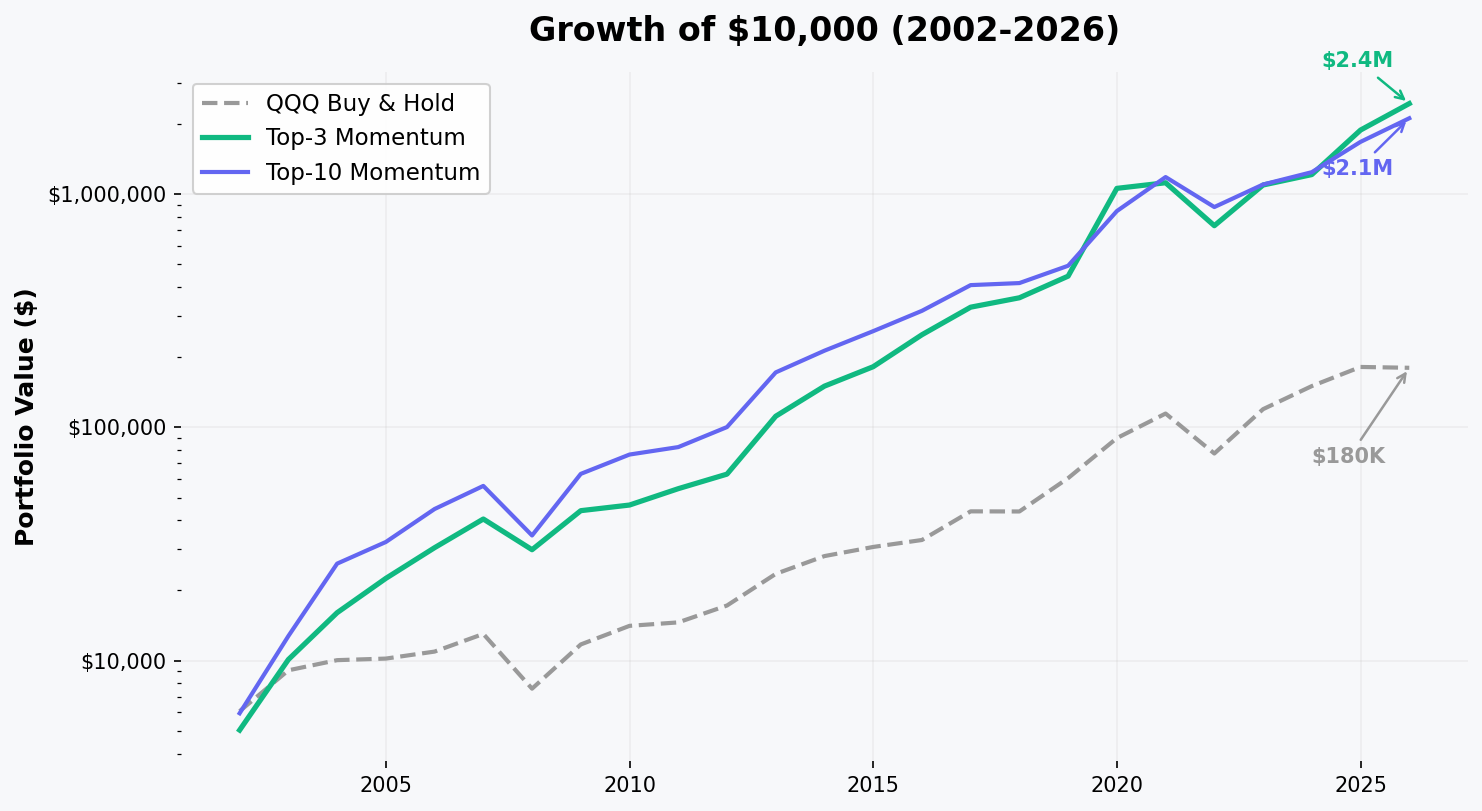
Top-3 momentum turned $10K into $2.4M. QQQ buy-and-hold turned $10K into $180K over the same period. That's a 13x difference.
Top-10 is arguably the better choice — it has a Sharpe of 0.95 (nearly 1.0) with a shallower max drawdown of -56.6%, while only giving up 0.8% CAGR vs Top-3.
What About 1999? The Outlier Year
If we extend the backtest to 1999, the numbers get even more dramatic: Top-3 returned +351% in 1999 alone, riding AMZN, QCOM, and VRSN during the dot-com mania. That single year inflates the full-period CAGR to 31.8% and the terminal value to $17.1M.
I'm showing the 2002-start numbers as the primary result because they're more conservative and honest — they strip out the dot-com bubble's extreme returns on both sides. The strategy doesn't need 1999 to make its case. Even starting from the bottom of the worst tech crash in history, it still delivered 25.6% CAGR over 24 years.
Year-by-Year Breakdown
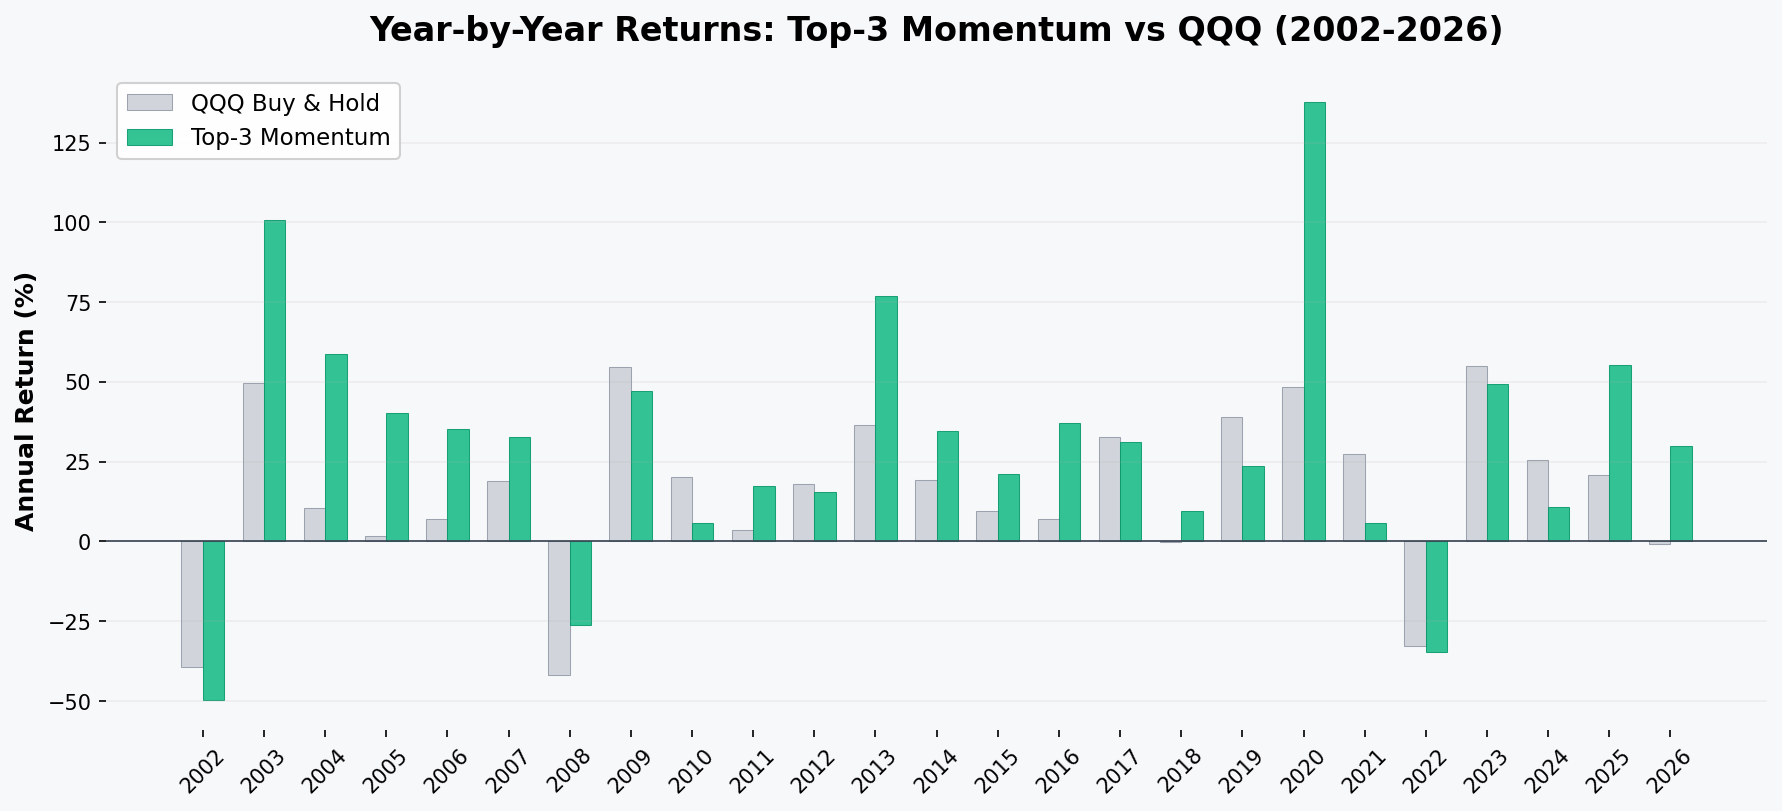
A few standout years:
- 2003: QQQ bounced +50%, but Top-3 did +101% (AKAM, BKNG leading the recovery)
- 2004: QQQ did +10.5%, Top-3 did +58.7% (MNST, BBBY, WYNN)
- 2013: QQQ +37%, Top-3 +77% (BBBY, MU, TSLA)
- 2020: QQQ had an incredible +48%, but Top-3 did +138% (TSLA at 83% allocation, plus ZM and DOCU)
Top-3 beat QQQ in 15 out of 25 years (60%). When it wins, it wins big. When it loses, the magnitude is usually similar to QQQ.
The worst year was 2002 at -49.6% (vs QQQ's -39.2%) — momentum got caught holding falling knives during the final leg of the dot-com crash. But the strategy recovered everything and more in the next two years.
Performance Across Market Eras
| Era | QQQ B&H | Top-3 | Top-10 |
|---|---|---|---|
| Dot-com Bottom (2002-03) | -4.6% | +0.6% | +12.9% |
| Recovery (2004-07) | +9.4% | +41.4% | +44.8% |
| GFC (2008-09) | -5.1% | +4.2% | +6.1% |
| Bull Run (2010-19) | +17.8% | +26.0% | +22.8% |
| Covid+ (2020-22) | +8.4% | +18.0% | +21.3% |
| AI Boom (2023-26) | +23.5% | +35.1% | +24.5% |
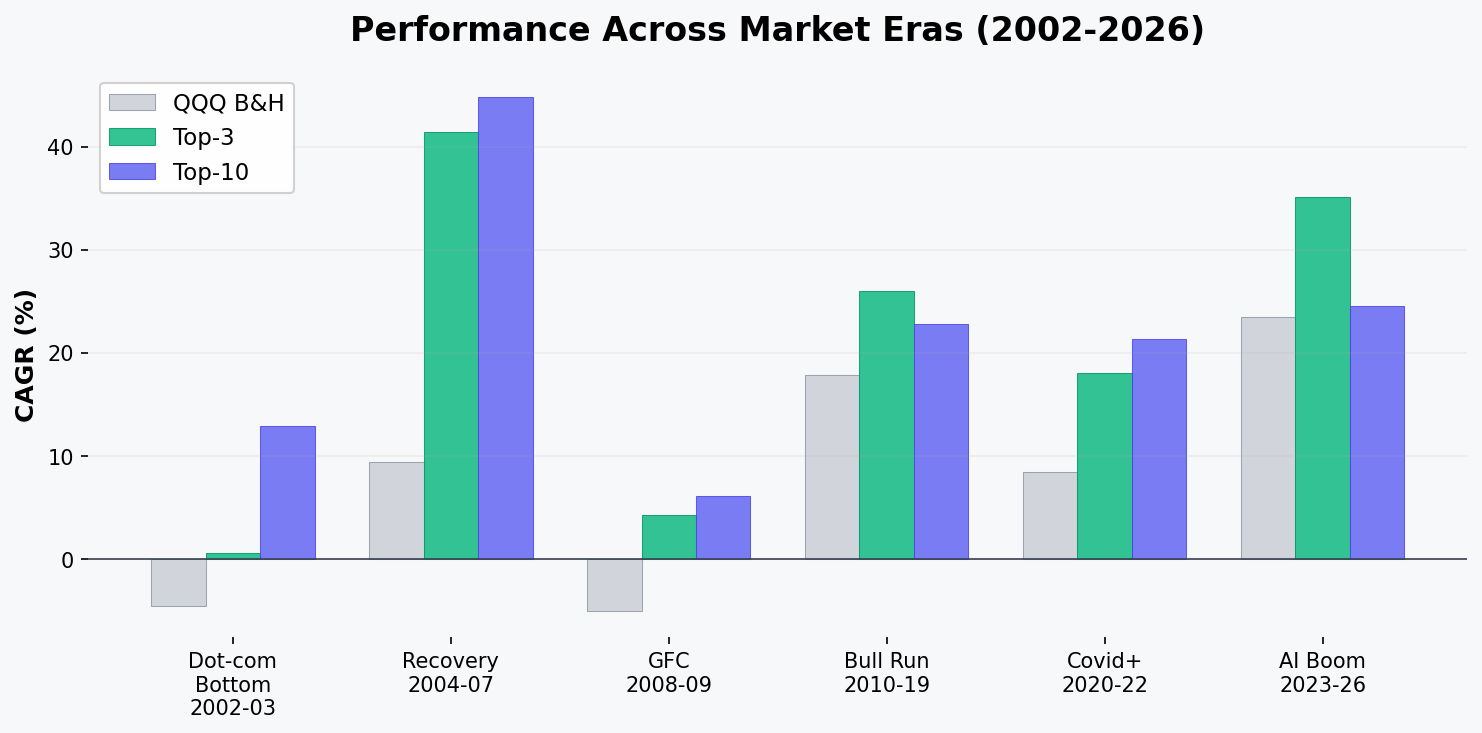
The strategy outperformed in every single era. During the GFC, it was positive (+4.2% CAGR) while QQQ lost money (-5.1%). During the 2004-07 recovery, it compounded at 41-45% annually vs QQQ's 9.4%.
This makes sense: momentum naturally rotates out of crashing stocks. When everything is falling, the "least bad" stocks still get selected, providing a built-in defensive mechanism.
What the Strategy Actually Held
Here are some of the most frequently held stocks over the years:
| Year | Top Holdings | What Drove Returns |
|---|---|---|
| 2003-04 | AKAM, BKNG, MNST, BBBY | Post-crash recovery leaders |
| 2005-06 | MNST (58-67%), AAPL, AKAM | Monster Beverage's legendary run |
| 2016 | NVDA (75% of months) | GPU revolution beginning |
| 2020 | TSLA (83%), ZM, DOCU | COVID winners |
| 2023 | NVDA (75%), PDD, META | AI boom |
| 2025 | PLTR (58%), APP (50%) | Enterprise AI + app economy |
NVDA appears more than any other stock — held for 53 total months across 17 separate streaks in the Top-3 variant. Its longest single streak was 10 months (June 2016 to March 2017, returning +111%).
The power law is real: a handful of momentum leaders drive most of the returns in any given period. The strategy's job is to find them early and ride them.
The Catch: Churn and Taxes
This isn't a set-and-forget strategy. The numbers on turnover are real:
- 51% of the portfolio gets replaced every month (Top-3)
- Median holding period: 1 month — 56% of positions last just one month
- ~18 trades per year for Top-3 (more for Top-10)
- 100% of gains are short-term capital gains — taxed at ordinary income rates
Does It Still Work After Taxes?
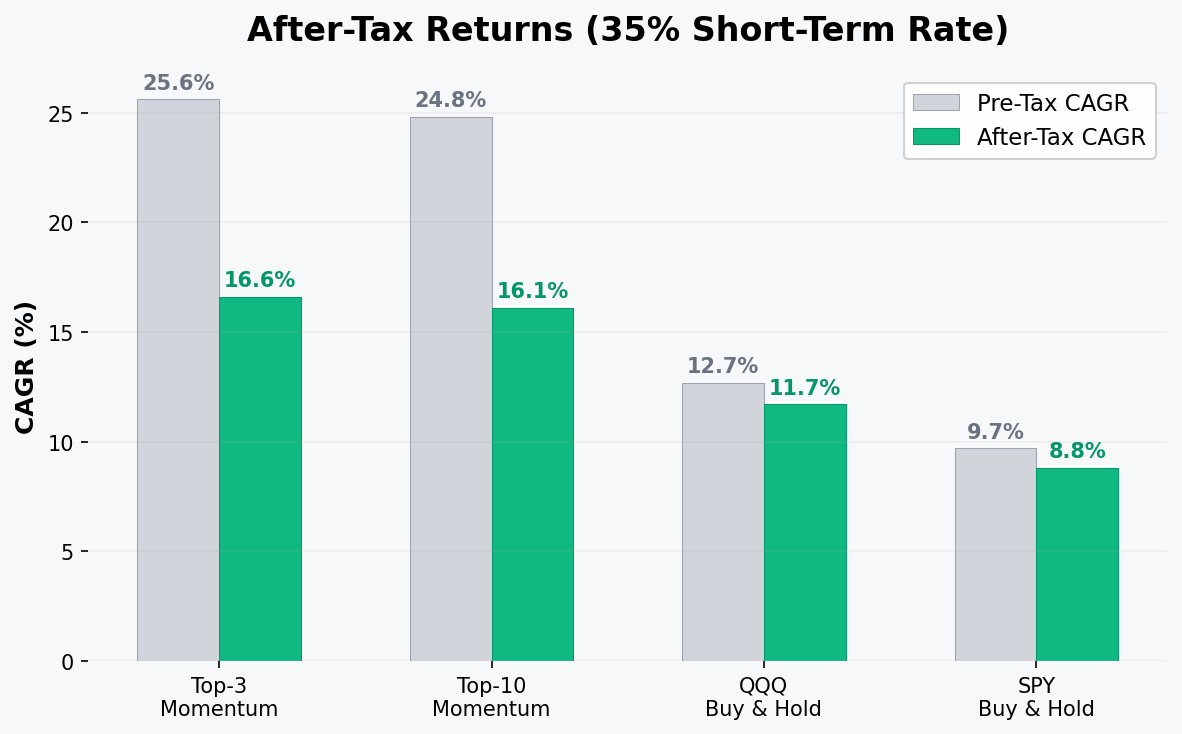
Assuming a 35% short-term capital gains tax rate (high bracket) applied every year:
| Strategy | Pre-Tax CAGR | After-Tax CAGR | $10K After Tax |
|---|---|---|---|
| Top-3 Momentum | 25.6% | 16.6% | $409K |
| Top-10 Momentum | 24.8% | 16.1% | $370K |
| QQQ Buy & Hold | 12.7% | 11.7% | $146K |
| SPY Buy & Hold | 9.7% | 8.8% | $76K |
Even after brutal 35% annual tax drag, the strategy beats QQQ's after-tax CAGR by ~5%. $10K becomes $409K after tax vs $146K for QQQ — still a 2.8x difference.
The alpha is large enough (~13% annual edge) that taxes eat into it but don't kill it. Tax drag costs about 9% CAGR, but you still keep 16.6%.
How to Minimize the Tax Hit
- Run it in a Roth IRA — zero tax on gains, full 25.6% CAGR compounds. This is the obvious optimal move.
- Tax-loss harvesting — high turnover means plenty of losing positions to harvest against other gains.
- Quarterly rebalance — fewer taxable events, some positions cross the 12-month LTCG threshold. Slight CAGR reduction.
The Honest Limitations
This backtest is rigorous, but not perfect:
-
Pre-2007 roster is approximate. Wikipedia's Nasdaq-100 component change data only goes back to February 2007. For 2002-2006, I reconstructed the roster backward from the 2007 composition. Some stocks from that era are missing. If anything, the real results would be better — more momentum candidates in the universe.
-
No slippage modeling. I included 10bps transaction costs, but didn't model market impact or bid-ask spreads. For Nasdaq-100 stocks (highly liquid), this should be minimal.
-
Drawdowns are severe. -63% max drawdown for Top-3 means watching $100K shrink to $37K. Most people can't stomach this. Top-10 is better at -57%.
-
Past performance. This is 24 years of backtested data. The future could be different. Momentum has worked across centuries and asset classes, but concentration in 3 stocks adds idiosyncratic risk.
Why Does It Work?
Momentum is one of the most robust anomalies in finance. It's been documented across every major stock market globally, commodities, currencies, bonds, and data going back to the 1800s.
The behavioral explanation: investors underreact to good news initially, creating a drift that momentum captures. By the time the crowd piles in, you're already holding.
The Nasdaq-100 is a particularly good universe for this because:
- High growth, high dispersion — the spread between the best and worst stocks is massive, giving momentum more signal to work with
- No micro-caps — all stocks are liquid, tradeable, and real businesses
- Self-cleaning — the index removes losers and adds winners automatically, providing a quality filter
The Bottom Line
| If you want... | Choose |
|---|---|
| Maximum raw returns | Top-3 (25.6% CAGR) |
| Best risk-adjusted returns | Top-10 (Sharpe 0.95) |
| Tax efficiency | Run either in a Roth IRA |
| Simplest implementation | Top-10 (less turnover, easier to manage) |
The strategy is dead simple: rank the Nasdaq-100 by 90-day returns, buy the top few, rebalance monthly. It has worked for 24 years across dot-com recovery, financial crises, pandemics, and AI booms. Even when you strip out the absurd 1999 outlier year, the edge holds.
The real question isn't whether momentum works. It's whether you can handle a -63% drawdown without panic selling. If you can, the math is overwhelmingly in your favor.
All data sourced from Yahoo Finance. Nasdaq-100 roster reconstructed using historical YAML data (2015-2026) and Wikipedia component changes (2007-2014). Transaction costs of 10bps included. This is not financial advice.