A Momentum Burst Strategy for NIFTY and BankNIFTY Futures
I spent weeks backtesting every combination of NIFTY and BankNIFTY switching strategies. Dual momentum, triple momentum with Reliance, spread trades, profit booking, trailing stops, vol-targeting — hundreds of permutations. Most of them produced mediocre results once you fix the look-ahead bias that plagues most retail backtests.
But one pattern kept showing up with a Sharpe above 1.3: short-term momentum continuation with leverage.
This post documents the full strategy, the reasoning behind each rule, and the backtest results from 2008 to 2026.
The Core Idea
Indian equity indices exhibit short-term autocorrelation — a green day tends to follow through to the next day. This isn't a new discovery. What makes this strategy work is combining that pattern with two filters:
- Which index to trade — using the BankNIFTY/NIFTY ratio
- When to sit out — using trend and cash filters
The result: you're only in the market 40% of the time, but you capture the momentum bursts with 2x leverage.
The Signal: BankNIFTY / NIFTY Ratio
BankNIFTY and NIFTY don't move in lockstep. When banking outperforms, the BN/N ratio rises. When it underperforms, the ratio falls. This ratio, compared to its 35-day simple moving average, tells you which index has the stronger trend.
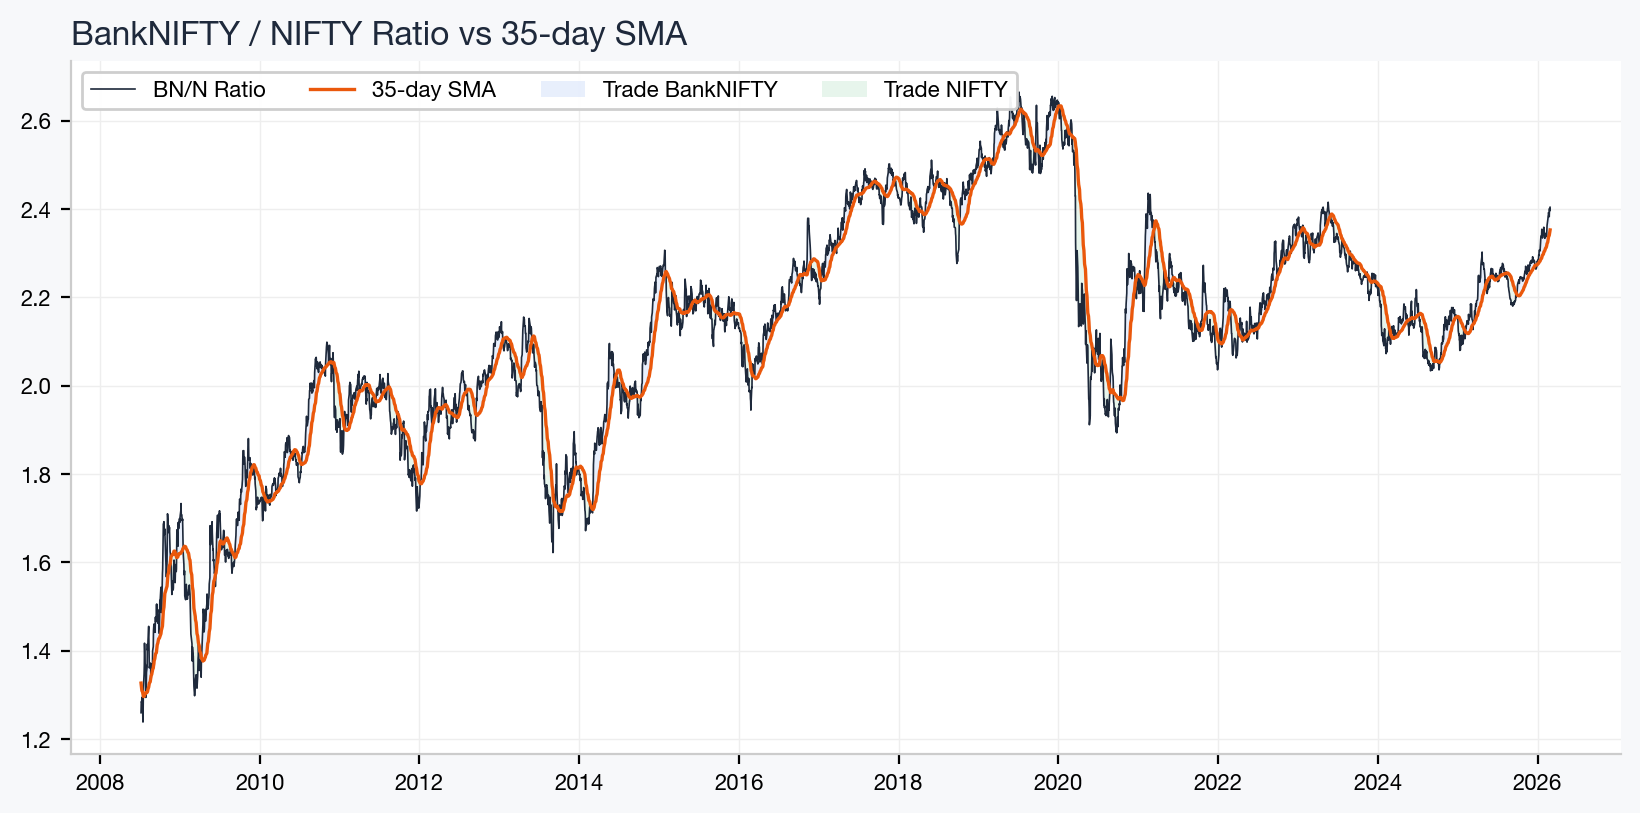
- Ratio above 35d SMA → trade BankNIFTY futures (banking is outperforming)
- Ratio below 35d SMA → trade NIFTY futures (broad market is stronger)
Why 35 days? I tested every lookback from 5 to 80 days. Shorter windows whipsaw too much given the 1-day execution lag. Longer windows are too slow to catch regime shifts. 35 is the sweet spot.
The Decision Flow
The strategy runs daily at 3:25 PM, about 5 minutes before market close.
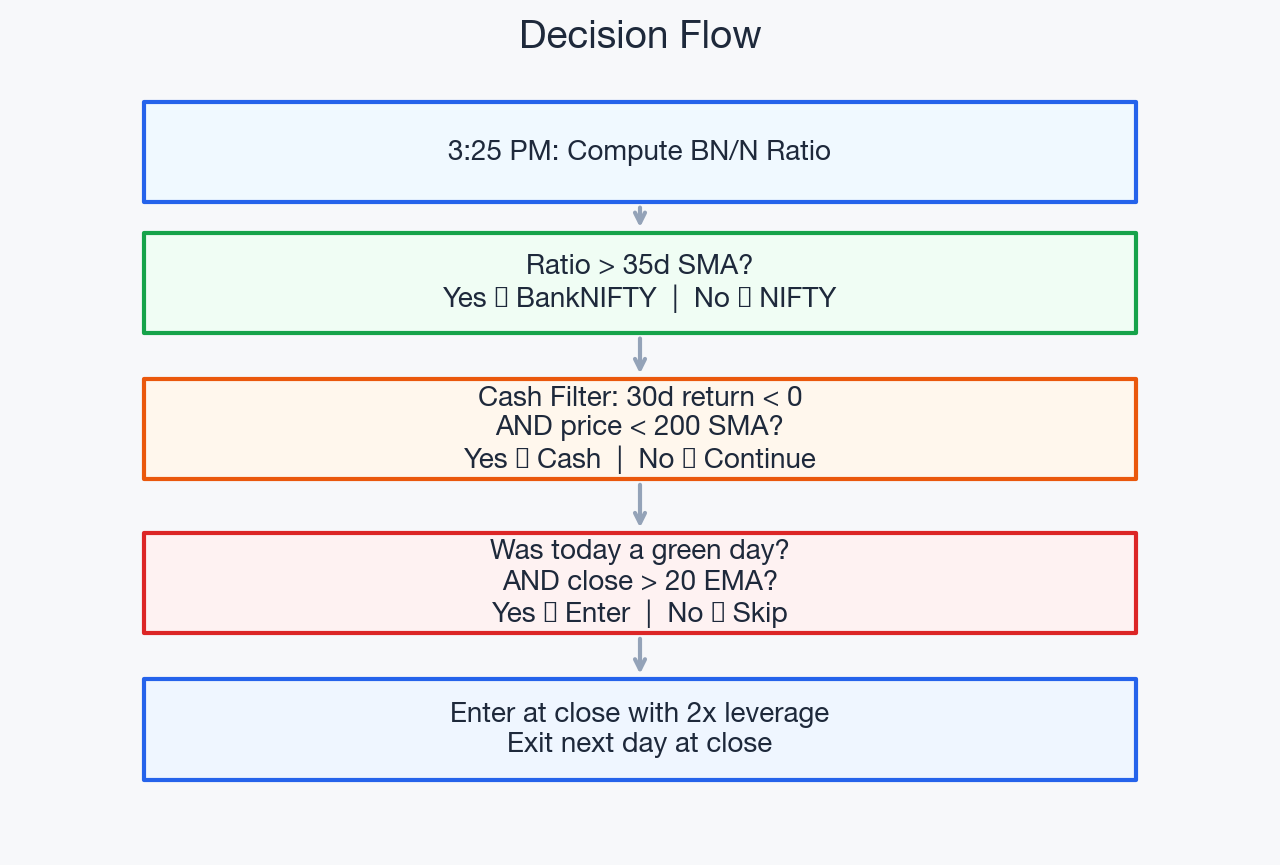
The rules:
- Pick the index: BN/N ratio > 35d SMA → BankNIFTY, else NIFTY
- Cash filter: If the picked index's 30-day return is negative AND its price is below the 200-day SMA → sit in cash. Both conditions must be true to exit. This means you stay in if either the short-term trend is positive or the long-term trend is intact.
- Entry trigger: Yesterday must have been a green day on the picked index AND the close must be above the 20 EMA
- Execution: Enter at market close with 2x leverage (2 lots per 1 lot of capital)
- Exit: Next day at close. No trailing stops. No profit targets.
Every signal uses the previous day's data — there's no look-ahead bias. You see the signal at 3:25 PM and execute at 3:30 PM.
Why Momentum Continuation Works
After a green day, the next day has a statistically higher expected return than after a red day. This is the autocorrelation edge.
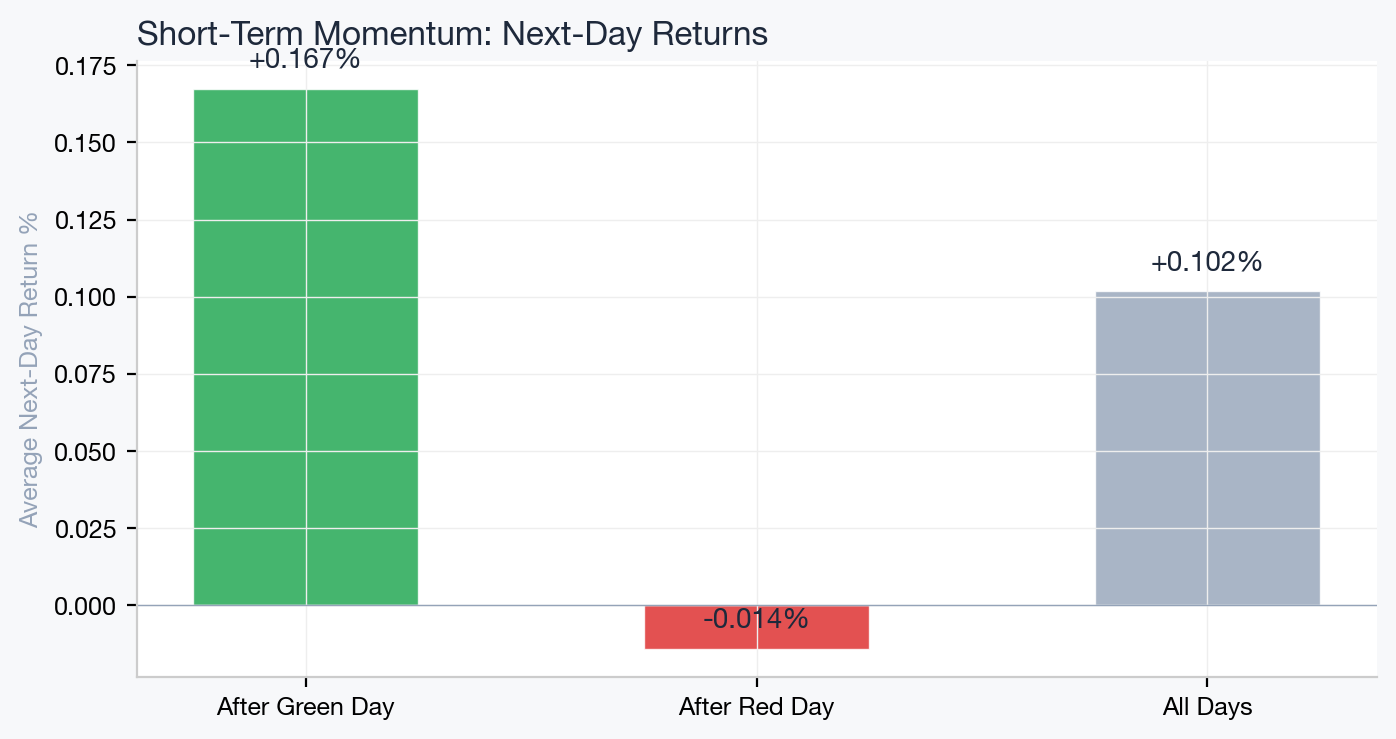
The effect is small on any single day — a few basis points. But compounded over ~740 trades across 17 years with 2x leverage, it adds up.
The 20 EMA filter strengthens this by ensuring you're only entering during uptrends. Momentum continuation is strongest when the broader trend is up. During choppy or falling markets, even green days are often just dead cat bounces.
Backtest Results
Period: July 2008 to February 2026 (17.5 years)
| Metric | Strategy | NIFTY B&H | BankNIFTY B&H |
|---|---|---|---|
| Rs 100 → | Rs 19,754 | Rs 627 | Rs 1,213 |
| CAGR | +36.0% | +11.3% | +15.6% |
| Sharpe Ratio | 1.38 | 0.57 | 0.59 |
| Max Drawdown | -30.5% | -45.4% | -50.3% |
| Win Rate | 57.0% | — | — |
| In Market | 40% | 100% | 100% |
| Worst Year | -3.9% | -26.3% | -32.4% |
Rs 1 lakh invested in 2008 would have grown to approximately Rs 1.97 crore, versus Rs 6.27 lakh for NIFTY buy-and-hold.
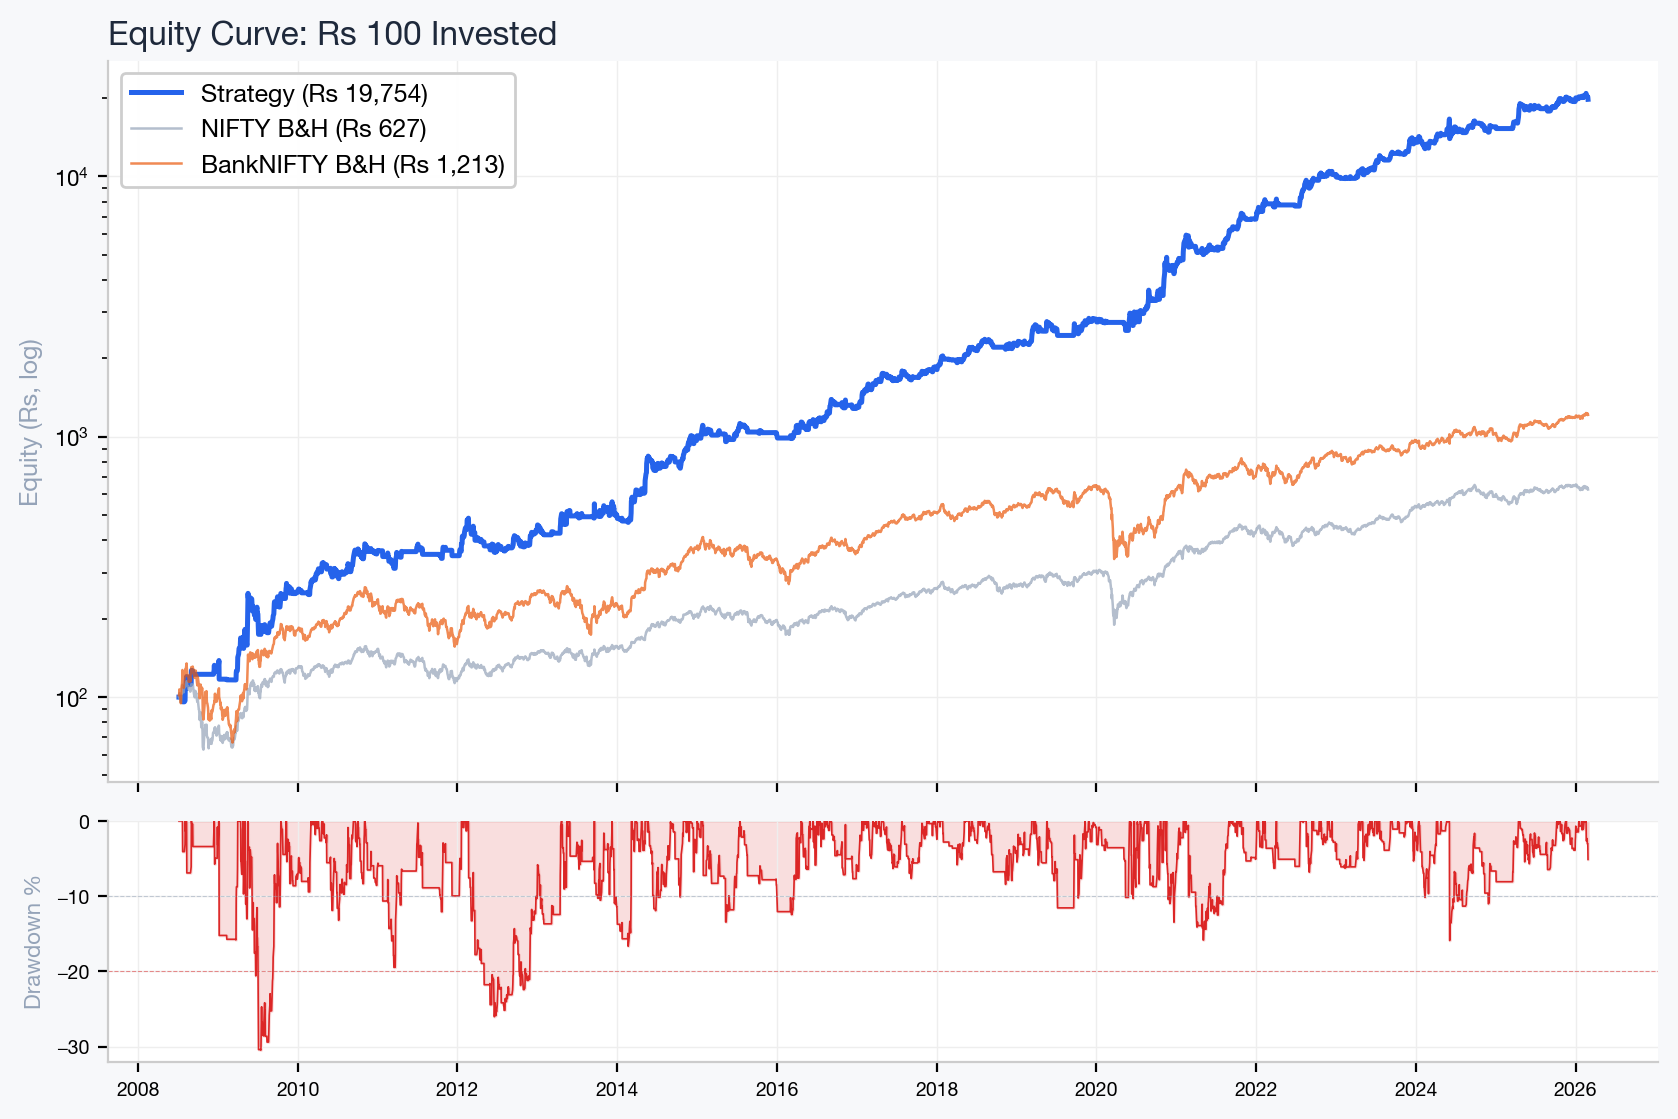
The drawdown chart shows the strategy's worst period was about -30%, compared to -45% for NIFTY and -50% for BankNIFTY during the same crashes.
Annual Returns
The strategy has been positive in nearly every year, even when the indices were flat or down.
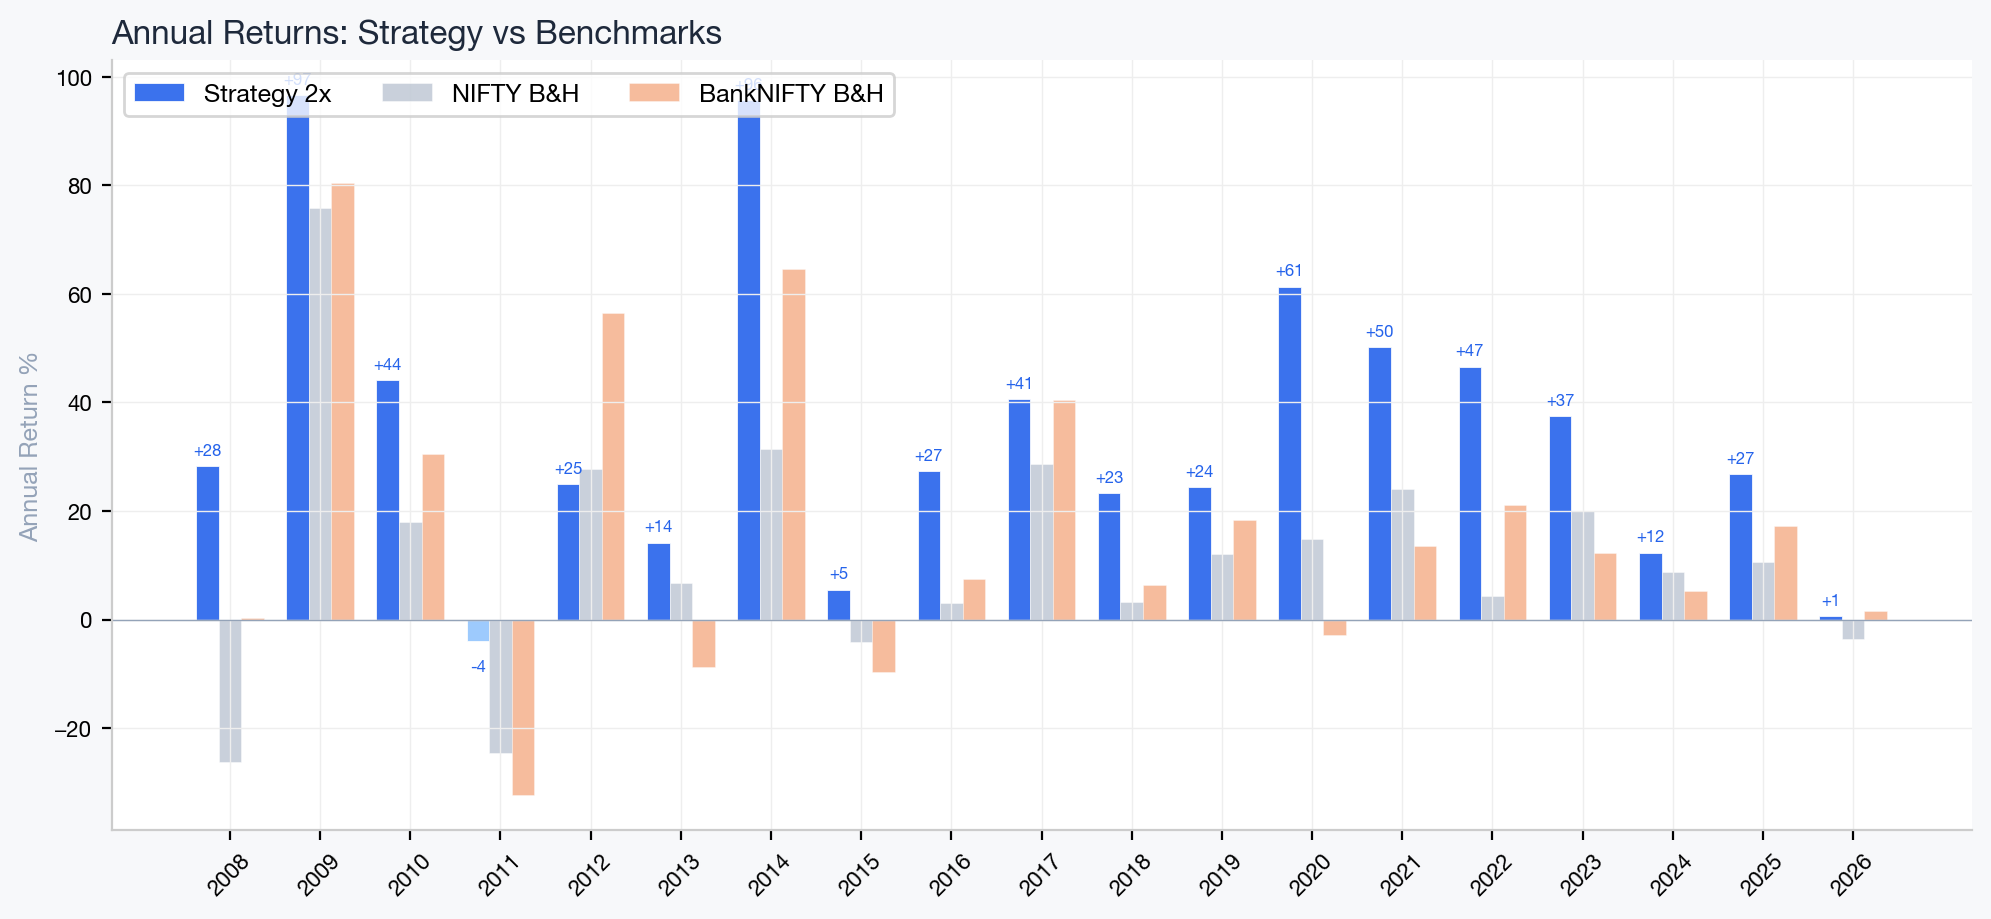
The worst year was -3.9%. Compare that to NIFTY's worst year of -26% and BankNIFTY's -32%. The strategy doesn't avoid all losses, but it avoids the catastrophic ones by being in cash during extended downtrends.
Position Allocation Over Time
This strip chart shows what the strategy was holding each day.
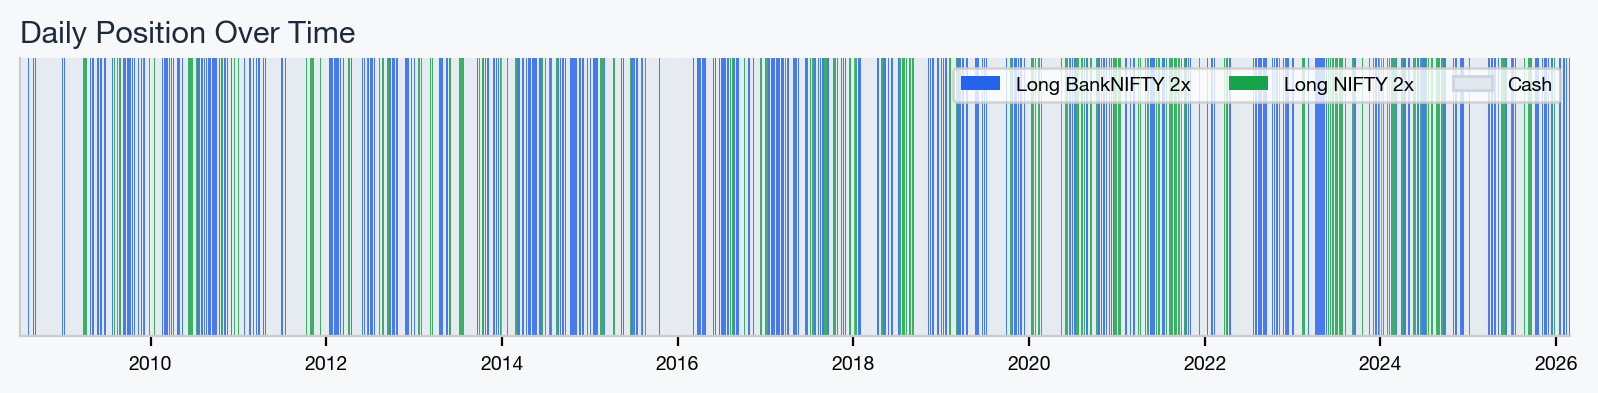
The strategy is in cash (gray) roughly 60% of the time. It only enters after confirmed momentum in an uptrend. During crashes (2008, 2020, 2022), it's almost entirely in cash.
Monthly Returns
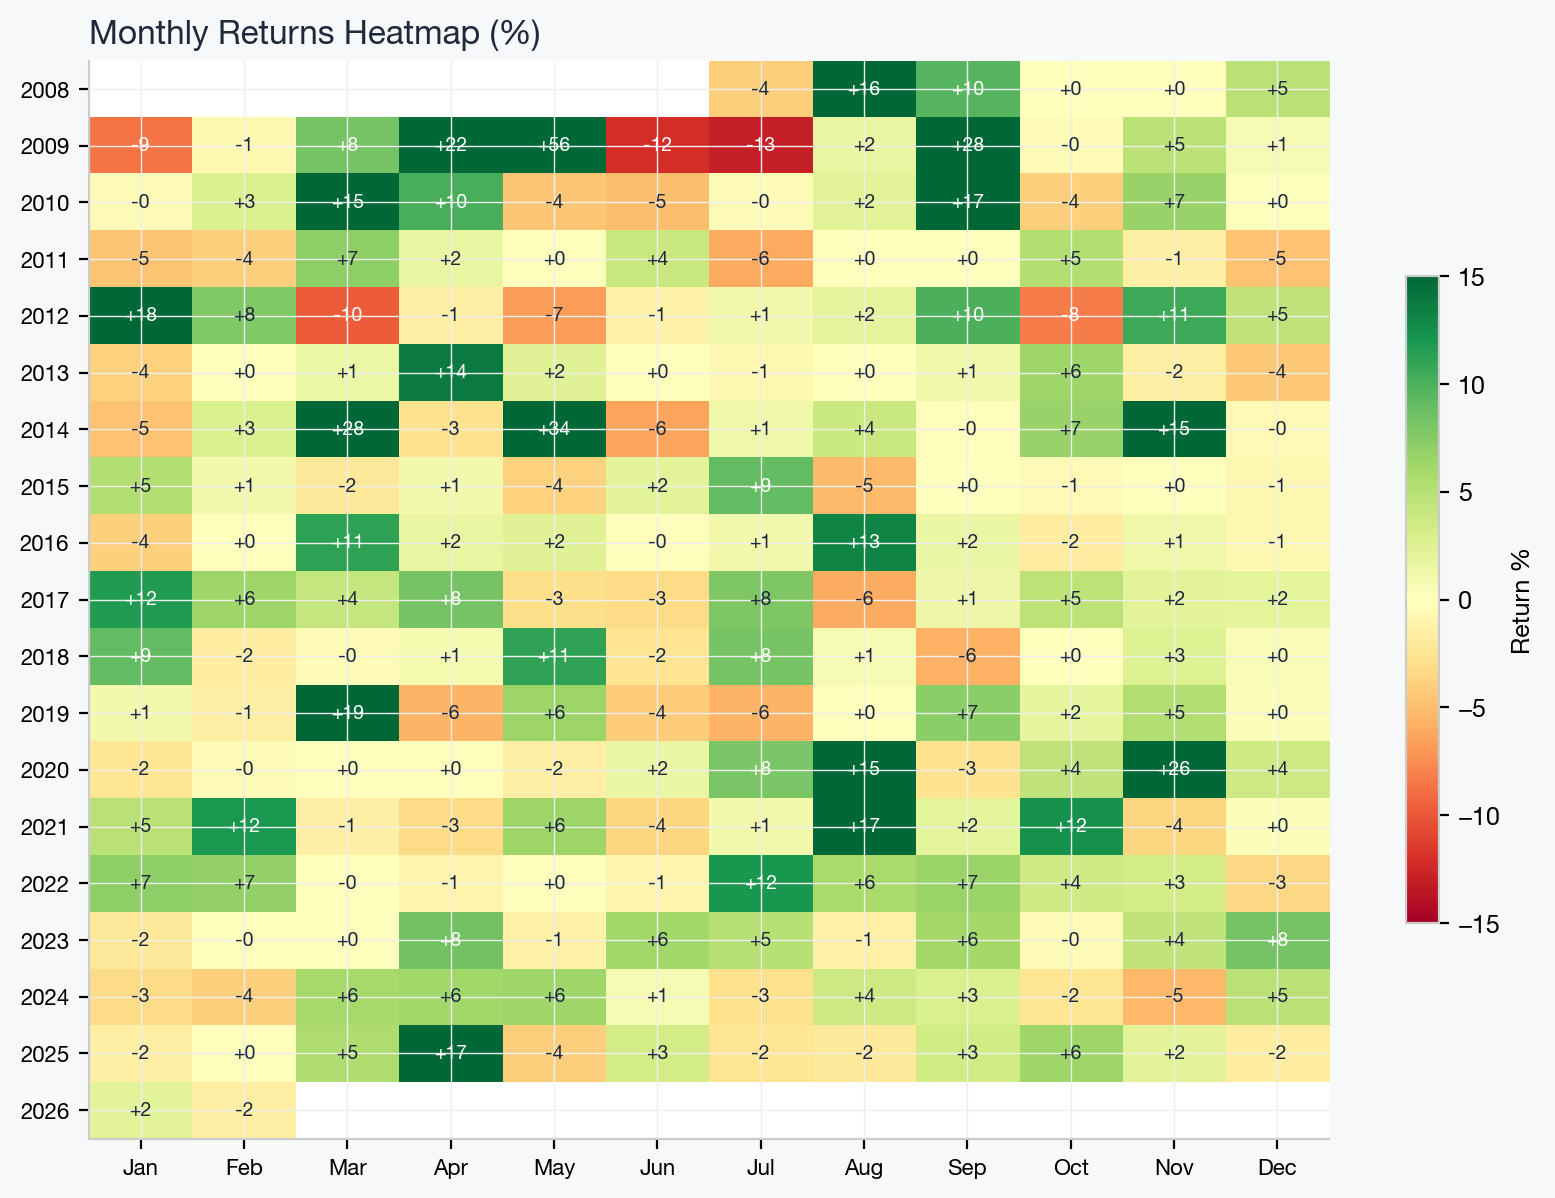
Most months are green or flat. The red months are shallow. There's no systematic pattern — the strategy doesn't have a "bad month" bias.
Rolling Performance
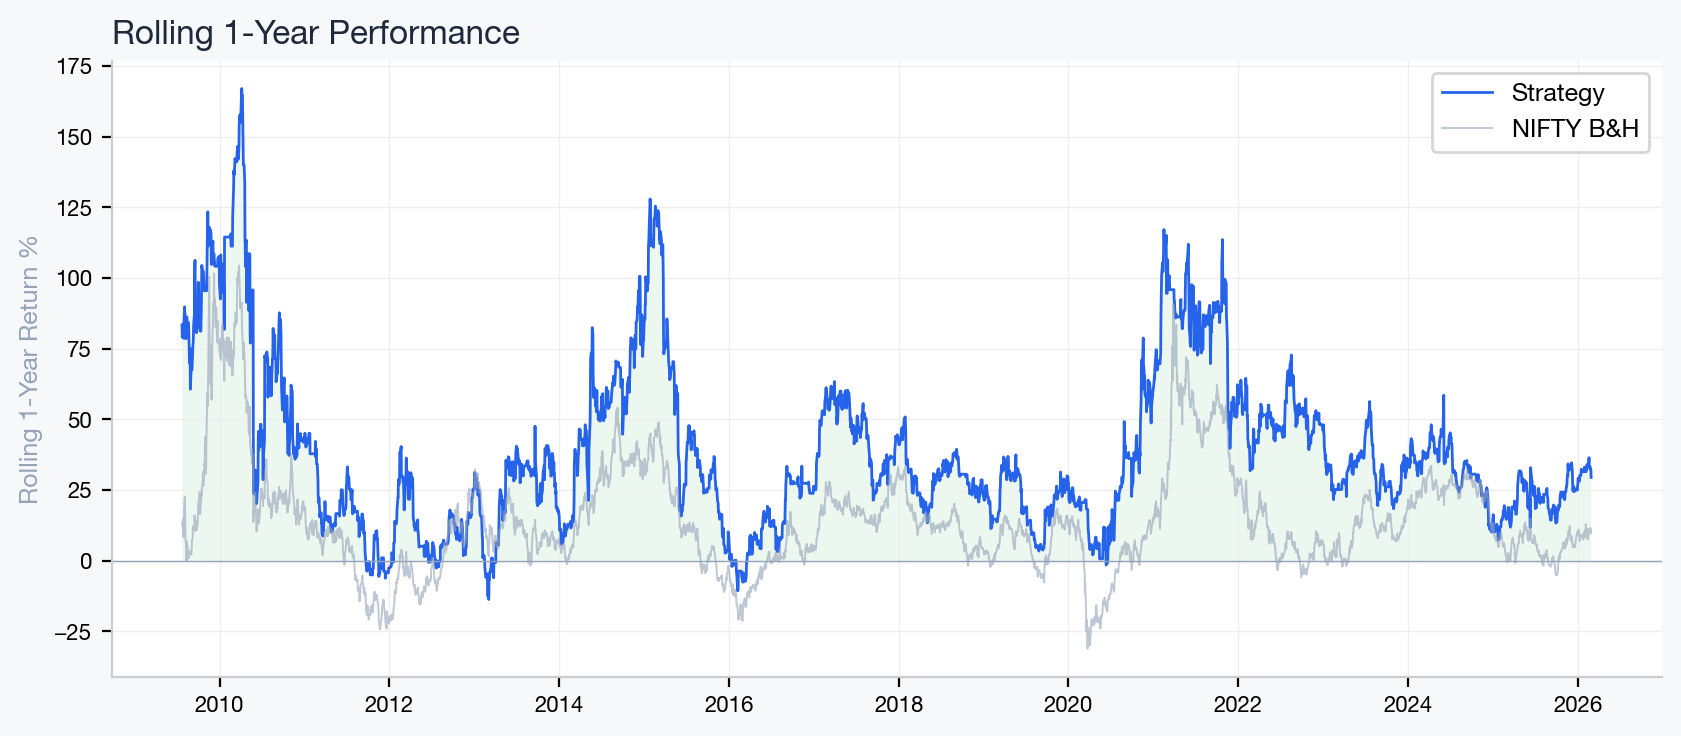
The strategy's rolling 1-year return has been positive the vast majority of the time. The few dips below zero are shallow and short-lived.
What I Tested and Rejected
This strategy was the survivor of hundreds of permutations. Here's what didn't work:
Profit booking — Trailing stops, fixed targets, monthly locks, winning streak exits. All of them either matched or underperformed the simple 1-day exit. The system already exits via the daily rebalance. Adding more exit logic just increases whipsaw.
Spread trading (long BN + short N) — Market-neutral spread gives only ~6% CAGR with 0.66 Sharpe. The ratio tells you which to be long, not that one will rise while the other falls. Shorting one leg cancels out market beta, which is where most of the return comes from.
EMA trailing stops (9, 13, 20) — Carrying forward positions with a trailing stop at EMA 9 drops Sharpe from 1.38 to 0.82. You stay in during chop and give back profits. The 1-day exit is already optimal.
Adding Reliance — Triple momentum with Reliance (10% of NIFTY) reduced Sharpe from 0.94 to 0.74 for the base system. Single stocks have too much idiosyncratic volatility and whipsaw the signal.
Volatility-targeted leverage — Scaling position size by realized vol sounds sophisticated but slightly hurt Sharpe. It levers up during calm periods (right before crashes) and levers down after vol spikes (right before recovery).
The Look-Ahead Bias Trap
A critical finding during this research: most momentum backtests have look-ahead bias. If your signal at time t uses today's closing price to decide today's trade, you're cheating — you're using information you don't have yet.
The correct approach: signal at time t determines the return at time t+1. You see the signal at 3:25 PM, enter at close, and your P&L starts from that close price. In code, this means shifting all signals by 1 day before calculating returns.
When I fixed this bias in my initial dual momentum backtest, the results collapsed from Rs 1 crore to Rs 549. The real edge is much smaller than most backtests suggest, which is why you need leverage and careful filtering to extract meaningful returns.
Practical Execution
Daily routine: At 3:25 PM, check the BN/N ratio vs its 35-day SMA. Check if today was green on the picked index and if the close is above 20 EMA. If yes, enter 2 lots at close. Exit next day at close.
Instruments: NIFTY near-month future (lot size 75, ~Rs 1.8L margin) or BankNIFTY near-month future (lot size 30, ~Rs 1.5L margin). Roll 2-3 days before expiry.
Capital: 2x leverage means 2 lots notional against your capital. With Rs 10L, you'd trade ~Rs 20L notional, deploying ~Rs 3-4L as margin with the rest as MTM buffer.
Costs: ~740 trades over 17 years is about 42 trades per year. At Rs 20/trade brokerage, that's Rs 840/year plus minimal STT. Transaction costs are negligible.
Limitations
- Backtest uses index close prices, not actual futures prices. Futures have basis premium.
- No slippage modeled. Real-world Sharpe will be 0.1-0.2 lower.
- The 1-day lag assumes you can always execute at close. In practice, the last 5 minutes can be volatile.
- The BN/N ratio relationship could change. The edge is based on 17 years of data, but regimes can shift.
- A -30% drawdown looks manageable on a chart. It doesn't feel manageable when it's your money.
Summary
The strategy exploits short-term momentum continuation in Indian equity futures, filtered by the BN/N ratio for index selection and trend filters for crash avoidance.
- Enter after a green day on the stronger index (above 20 EMA)
- Exit next day at close
- 2x leverage, in market 40% of the time
- 1.38 Sharpe, +36% CAGR, -30% max DD over 17.5 years
The edge isn't in any single clever trick — it's in the combination of a simple momentum pattern, disciplined filtering, and not overstaying in positions.